
Jean-Baptiste Colbert, France’s Minister of Finances from 1665 to 1683, allegedly said that “the art of taxation consists in so plucking the goose as to obtain the largest amount of feathers with the least possible amount of squawking.” A contentious report, initially withdrawn, has been reissued by the Congressional Research Service. The report, Taxes and the Economy: An Economic Analysis of the Top Tax Rates Since 1945, (Taxes and the Economy) looks at what, if any, impact a reduction in income tax rates has on the economy and concludes “…the reduction in the top tax rates have had little association with saving, investment, or productivity growth. However, the top tax rate reductions appear to be associated with the increasing concentration of income at the top of the income distribution.” The usual suspects have criticized the report’s findings.
The Tax Foundation has cited two flaws. The first is that “it takes one to five years for a reduction in the tax on capital income to generate all the associated…” benefits to the economy. Thus, we should see a five year lag between the initiation of a tax cut and a bump to economic output – which makes sense.
The second problem the Tax Foundation lists was that the study “…does not hold other factors constant. Shifts in monetary policy, changes in other taxes, regulatory actions, even weather-related effects on the economy can have significant impacts on the measured growth rate in a given year.” Which is also true, but is likely impossible to conclusively quantify. I could use this very argument against those who claim that tax cuts stimulate the economy.
Hence, the graph shown below which compares the top marginal tax rate since the end of the Second World War (red line) with the annual percentage change in U.S. Gross Domestic Product (blue line). What you see is that the economy is cyclical and tends to expand or contract annually within a certain range. But what you also see is the long term decline in the top U.S. marginal individual income tax rate.
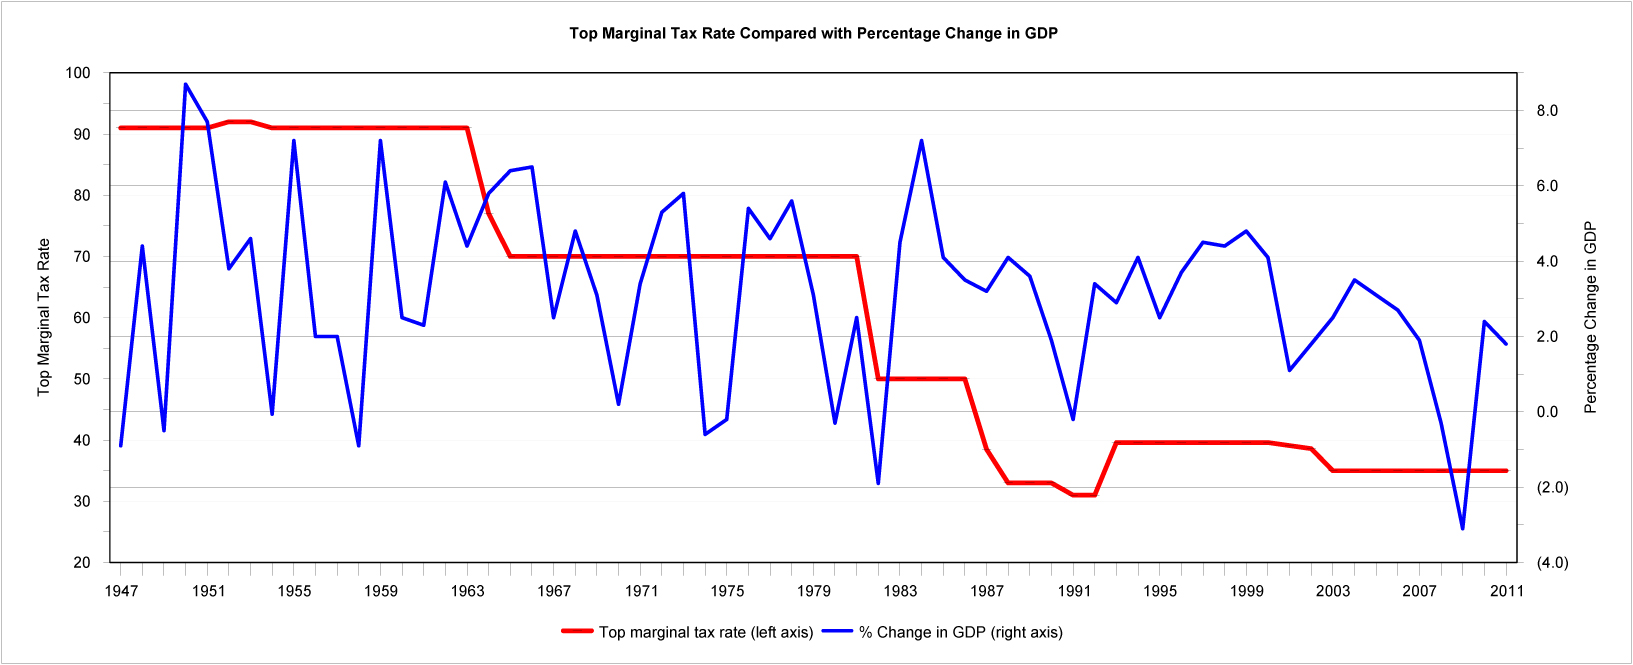
If there is a correlation between tax cuts and economic expansion, it does not appear to last very long or to be the primary driver of economic growth. Perhaps the only conclusion you can reach is that tax cuts do not greatly influence economic expansions since “[s]hifts in monetary policy, changes in other taxes, regulatory actions, even weather-related effects on the economy can have significant impacts on the measured growth rate in a given year” – The Tax Foundation.
…………
The Congressional Research Service is a public policy research arm of the United States Congress. As a legislative branch agency within the Library of Congress, CRS works primarily and directly for Members of Congress, their Committees and staff on a confidential, nonpartisan basis.
…………
The Technical Details
Data on marginal income tax rates comes from Tax Analysts. Historical GDP comes from the Bureau of Economic Analysis (BEA). The chart in this blog uses chain-type estimates for GDP since they provide the best available method for comparing the level of a given series at two points in time. Chained-dollar estimates are obtained by multiplying the chain-type quantity index for an aggregate by its value in current dollars in the reference year (currently 2005) and dividing by 100. For analysis of changes over time in an aggregate or in a component, the percentage changes calculated from the chained-dollar estimates and the chain-type quantity indexes are the same. Thus, chained-dollar estimates can be used to compute “real” (i.e., inflation-adjusted) rates of growth.
The BEA is an agency of the Department of Commerce and produces economic accounts statistics that enable government and business decision-makers, researchers, and the American public to follow and understand the performance of the economy.
