• Antarctica
  • Book Reviews
  • Economics and Taxation
  • Photographs
  • Political Commentary
  • Running
  • Science
  • Short Stories
  • Travel
  • About Richard Watson

Richard Watson

~ Commentary

Richard Watson

Category Archives: Economics and Taxation

Taxing Times

02 Thursday Feb 2017

Posted by Richard Watson in Economics and Taxation, Political Commentary

≈ Leave a comment

Tags

Nonprofit Organizations, Taxation

If Trump is serious about lifting the prohibition against political activities on the part of churches, then they must be taxed. Churches, as well as other charitable organizations, are prohibited from engaging in political activities. This is not a gag on freedom of speech. Rather, it is a condition on receiving an exemption from income tax and a well established principle of law.

In 1934, Congress amended the statutory predecessor of §501(c)(3) to include the restriction that no substantial part of an organization’s activities may constitute carrying on propaganda, or otherwise attempting, to influence legislation. The intent of the Finance Committee was to stop deductible contributions for legislative ends.

The prohibition of §501(c)(3) organizations from engaging in political activities came into being in 1954, when Lyndon Johnson proposed an amendment to the tax code in order to deny tax exempt status to not only those organizations “…who influence legislation but also to those who intervene in any political campaign on behalf of any candidate for public office.” Congress had previously contemplated inserting language in the code that would have prohibited organizations from participating in “partisan politics” back in 1934, but a draft provision was deleted, because it was thought to be overly broad. Nevertheless, that same year, Congress did amend the code to restrict lobbying activities.

In Regan v. Taxation With Representation of Washington, the Supreme Court upheld the congressional limitation on §501(c)(3) lobbying activities because an organization’s First Amendment rights are preserved through its ability to speak through an affiliated action fund. The Court stated “the IRS…requires only that the two groups be separately incorporated and keep records adequate to show that tax deductible contributions are not used to pay for lobbying. This is not unduly burdensome.”

In Branch Ministries v. Commissioner, the District Court of DC upheld the revocation of a church’s tax exemption under §501(c)(3), because the church had expressed its concern about the moral character of a candidate in the 1992 presidential elections. The church had placed advertisements in USA Today and the Washington Times, stating amongst other things that “…Clinton is promoting policies that are in rebellion to God’s laws,” and “tax deductible donations for this advertisement gladly accepted.”

The Internal Revenue Code treats churches differently from other tax-exempt organizations. While a church may file for Section 501(c)(3) status, it is not required to do so in order to be tax-exempt. A church may simply hold itself out as a church and claim exempt status pursuant to Section 508(c). However, partisan political activities are a direct violation of Section 501(c)(3). The Court noted that the

…plaintiffs have failed to establish that the revocation of the Church’s Section 501(c)(3) tax-exempt status substantially burdened its right to freely exercise its religion…The fact that plaintiffs may now have less money to spend on the religious activities as a result of their participation in a partisan political activity, however, is insufficient to establish a substantial burden on their free exercise of religion. [emphasis added]

There are situations where an organization may engage in advocacy which is essentially political, or where the political actions of others can be attributed to an organization.

In its 2002 Continuing Professional Education Manual, the IRS discussed the possibility that advocacy of an issue might cross the line into “participation or intervention” in a political campaign:

The concern is that an IRC 501(c)(3) organization may support or oppose a particular candidate in a political campaign without specifically naming the candidate by using code words to substitute for the candidate’s name in its messages, such as “conservative,” “liberal,” “pro-life,” “pro-choice,” “anti-choice,” “Republican,” “Democrat,” etc., coupled with a discussion of the candidacy or the election. When this occurs, it is quite evident what is happening– an intervention is taking place…the fundamental test that the Service uses to decide whether an IRC 501(c)(3) organization has engaged in political campaign intervention while advocating an issue is whether support for or opposition to a candidate is mentioned or indicated by a particular label used as a stand-in for a candidate.

The IRS realizes that staff of public charities may become involved in political campaigns and may even endorse candidates. To avoid attribution, charities should ensure that their staff understand the rules, particularly since the use of a nonprofit’s “financial resources, facilities, or personnel” is indicative that the actions of the individual should be attributed to the organization.

The CPE Manual states:

The prohibition against political campaign activity does not prevent an organization’s officials from being involved in a political campaign, so long as those officials do not in any way utilize the organization’s financial resources, facilities, or personnel, and clearly and unambiguously indicate that the actions taken or the statements made are those of the individuals and not of the organization.

There may also be situations where candidates speak at charitable events in their capacity as public figures. Once again, the IRS CPE Manual provides guidance:

Candidates may also be invited to speak at events by IRC 501(c)(3) organizations in their capacity other than as a candidate. Many candidates are public figures for reasons other than their candidacy. For instance, a number of candidates either currently hold or formerly held public office or may be experts in a non-political field. A candidate also might be a public figure as a result of a prior career, such as an acting, military, legal, or public service career. When a candidate is invited to speak at an event in a capacity other than as a candidate, it is not necessary for the IRC 501(c)(3) organization to provide equal access to all candidates. However, the IRC 501(c)(3) organization must ensure that the candidate speaks only in the other capacity and not as a candidate, that no mention is made of the individual’s candidacy at the event, and that no campaign activity occurs in connection with the candidate’s attendance at the event.

One example of the IRS position on organizational endorsements is a public statement which was negotiated with Jimmy Swaggart Ministries as a condition for recovering its tax-exemption:

When a minister of a religious organization endorses a candidate for public office at an official function of the organization…the endorsement will be considered an endorsement by the organization since the acts and statements of a religious organization’s ministers at official functions…and its official publications are the principal means by which a religious organization communicates its official views to its members and supporters.

20170204_cuk400

A Duck Walks Into a Starbucks…

08 Saturday Jun 2013

Posted by Richard Watson in Economics and Taxation

≈ Leave a comment

A man walks into a Starbucks and orders a Double Irish with a Dutch Sandwich and proceeds to open his Apple MacBook Pro and Googles “a man walks into a bar jokes…”

A rabbi, a priest, and a Lutheran minister walk into a bar. The bartender looks up and says, “Is this some kind of joke?”

Not really…it is more an elaborate multinational tax strategy that allowed Google to avoid $2 billion in tax in 2011 by moving income to a subsidiary in Bermuda; Apple to avoid paying tax on $44 billion in income; and GE to hold $108 billion in offshore profits, among others. And all because the U.S. Treasury Department wished to simplify the tax code back in 1996 with something called “check the box.” Simplicity, however, can be overwhelmed with complexity.

“Check the box” seems an innocent enough phrase. The idea is that U.S. firms can decide how to classify a subsidiary for tax purposes. Like a magic trick, a company checks a box on a form and makes a subsidiary disappear – as if it never existed. In tax parlance, the subsidiary becomes a “disregarded entity.”

After setting up the “check the box” rule, the Treasury realized it had a problem, because there was an increase in cross-border financing. The Commerce Department estimates that U.S. companies keep some $1.8 trillion in earnings abroad.

Here is where simplicity gets complex…

A Double Irish requires two Irish corporations. The first company, which we’ll call “Pat,” is tax resident in Ireland – that is, Pat pays Irish income tax. Pat pays a second Irish company, which we’ll call “Mike,” a royalty for the use of intellectual property. This allows Pat to reduce its Irish tax bill for the expense of the royalty payment to Mike. This is why so many software companies love the Double Irish. Software is considered intellectual property.

The second Irish company, Mike, owns Pat and is not tax resident in Ireland (under Irish tax law, a company is tax resident where its central management and control is located, not where it is incorporated). Mike actually collects the royalties in someplace like Bermuda, which has no corporate income tax. Plus, Mike usually charges Pat above-market rates.

A guy walks into a bar. The guy behind him ducks.

This is where “check the box” reenters the picture. If Mike makes an entity classification election for Pat to be “disregarded” by checking the box, the payments between Pat and Mike are ignored for U.S. tax purposes – as if they never existed. Of course, if money is repatriated back to the U.S. it will be taxed. Before being hauled before the U.S. Senate to explain themselves, Apple was lobbying Congress to allow tax free repatriation of overseas funds.

The final item on the lunch buffet is the Dutch Sandwich. Because as you know, without bread, the sandwich falls apart. To avoid Irish withholding tax, a Dutch subsidiary is used because Ireland does not levy withholding on royalty receipts from European Union members. So, the money starts off on the books in the Netherlands, flows through Ireland and then on to Bermuda. A rather nice, virtually tax-free holiday.

There are approximately 1,000 multinationals with operations in Ireland.

A man walks into a bar and orders a drink, then discovers he has to go to the bathroom. To stop anyone stealing his drink he puts a note on it saying, ‘I spat in this beer.’ When he returns he finds another note saying, ‘So did I!’

ducks

A duck walks into a bar…

Plucking the Goose

17 Monday Dec 2012

Posted by Richard Watson in Economics and Taxation

≈ Leave a comment

Tags

Taxes and the Economy, Taxing the Rich

Jean-Baptiste Colbert, France’s Minister of Finances from 1665 to 1683, allegedly said that “the art of taxation consists in so plucking the goose as to obtain the largest amount of feathers with the least possible amount of squawking.” A contentious report, initially withdrawn, has been reissued by the Congressional Research Service. The report, Taxes and the Economy: An Economic Analysis of the Top Tax Rates Since 1945, (Taxes and the Economy) looks at what, if any, impact a reduction in income tax rates has on the economy and concludes “…the reduction in the top tax rates have had little association with saving, investment, or productivity growth. However, the top tax rate reductions appear to be associated with the increasing concentration of income at the top of the income distribution.” The usual suspects have criticized the report’s findings.

The Tax Foundation has cited two flaws. The first is that “it takes one to five years for a reduction in the tax on capital income to generate all the associated…” benefits to the economy. Thus, we should see a five year lag between the initiation of a tax cut and a bump to economic output – which makes sense.

The second problem the Tax Foundation lists was that the study “…does not hold other factors constant. Shifts in monetary policy, changes in other taxes, regulatory actions, even weather-related effects on the economy can have significant impacts on the measured growth rate in a given year.” Which is also true, but is likely impossible to conclusively quantify. I could use this very argument against those who claim that tax cuts stimulate the economy.

Hence, the graph shown below which compares the top marginal tax rate since the end of the Second World War (red line) with the annual percentage change in U.S. Gross Domestic Product (blue line). What you see is that the economy is cyclical and tends to expand or contract annually within a certain range. But what you also see is the long term decline in the top U.S. marginal individual income tax rate.

graph

If there is a correlation between tax cuts and economic expansion, it does not appear to last very long or to be the primary driver of economic growth. Perhaps the only conclusion you can reach is that tax cuts do not greatly influence economic expansions since “[s]hifts in monetary policy, changes in other taxes, regulatory actions, even weather-related effects on the economy can have significant impacts on the measured growth rate in a given year” – The Tax Foundation.

…………

The Congressional Research Service is a public policy research arm of the United States Congress. As a legislative branch agency within the Library of Congress, CRS works primarily and directly for Members of Congress, their Committees and staff on a confidential, nonpartisan basis.

…………

The Technical Details

Data on marginal income tax rates comes from Tax Analysts. Historical GDP comes from the Bureau of Economic Analysis (BEA). The chart in this blog uses chain-type estimates for GDP since they provide the best available method for comparing the level of a given series at two points in time. Chained-dollar estimates are obtained by multiplying the chain-type quantity index for an aggregate by its value in current dollars in the reference year (currently 2005) and dividing by 100. For analysis of changes over time in an aggregate or in a component, the percentage changes calculated from the chained-dollar estimates and the chain-type quantity indexes are the same. Thus, chained-dollar estimates can be used to compute “real” (i.e., inflation-adjusted) rates of growth.

The BEA is an agency of the Department of Commerce and produces economic accounts statistics that enable government and business decision-makers, researchers, and the American public to follow and understand the performance of the economy.

Cliff Notes, Part II – Tea Time

14 Friday Dec 2012

Posted by Richard Watson in Economics and Taxation

≈ 1 Comment

Tags

Deficit, Federal Budget, Federal Debt, Federal Spending, Fiscal Cliff

For some historical context, see Part I of this blog, Putting the Kettle On.

As I was working on the numbers for this blog, the most shocking statistic I came across concerned the annual federal budget. Only five out of the last fifty years have shown a budget surplus, and three of those years were under Clinton. The other forty-five years ran budget deficits. The highest surplus was in the year 2000 when government coffers were $236 billion to the good. So the logical question in any financial analysis of the United States is what did Clinton do right, and why has it gone so wrong in just ten years? But first, some Cliff Notes…

The Cliffs of Washington

There is a cliff, whose high and bending head
Looks fearfully in the confined deep;
Bring me to the very brim of it…
– William Shakespeare, King Lear

The Economist has estimated that the combination of tax increases and spending cuts that automatically go into effect on January 1, 2013, should no agreement be reached by Congress to extend Bush era tax cuts or postpone spending cuts, is worth up to 5% of Gross Domestic Product (GDP). The growth of United States’ economy is slowing and is expected to be as little as 1% in the fourth quarter of 2012. This sets the stage for a possible 4% contraction in the economy in the first quarter of 2013. The Journal of Accountancy observes that…

Rarely has there been such a major difference between the laws in effect one year and the next. The maximum income tax rates next year could be as high as 43.4% on ordinary income (44.6% if the potential impact of reinstated limitations on itemized deductions is taken into account) and 23.8% on long term capital gains (or 25% if itemized deduction limitations are factored in). In addition, unless Congress acts, millions of additional taxpayers will be liable for the alternative minimum income tax (AMT) for 2012 because the most recent AMT patch expired at the end of 2011. Further, the current 2% payroll tax holiday is scheduled to expire at the end of this year…In addition to the new 3.8% Medicare surtax on net investment income, starting in 2013 a new 0.9% Medicare surtax will apply to wages and self-employment income of taxpayers with MAGI [modified adjusted gross income] in excess of…threshold amounts.

This is what Ben Bernake, the chairman of the Federal Reserve, has called a fiscal cliff. It is not a sheer cliff, but you can expect the ride to get bumpy. But really, it has been all downhill since the year 2000. Rather than heading off a cliff, we are charging into a valley in the Crimean peninsula. You know the bit by Tennyson (which doesn’t end well):

‘Forward, the Light Brigade!’
Was there a man dismayed?
Not though the soldier knew
Some one had blundered:
Theirs not to make reply,
Theirs not to reason why,
Theirs but to do and die,
Into the valley of Death
Rode the six hundred.

So I thought the thing to do was to take a look at the numbers and try to figure out what changed since Bill Clinton ran the show in 2000 when the Republicans were just a bunch of sex-obsessed obstructionists. You remember Kenneth Star?

Methodology
I obtained various spreadsheets from the Office of Management and Budget and combined them into an historical record of federal receipts and expenditures for the last fifty years. Those intrepid enough to wade though the detail can download the spreadsheet here – US Budget – and browse the data using Excel. Perhaps you will discover your own interesting observations. I also gathered some figures from the U.S. Census Bureau and tried to correlate population trends with changes in the federal budget. Data concerning revenue primarily comes from the Internal Revenue Service (IRS).  Another good source of tax data is Tax Analysts’ Tax History Project. They have a delightful section from where you can download presidential tax returns going back to Franklin Roosevelt.

Often, you’ll see historical figures adjusted for inflation. But I do not do this. I am taking what I call a “household” approach to looking at the data. You have money coming in, and money going out. As you take in more, you can spend more. But when times are lean, you need to scale back. To me, percentage comparisons are more revealing – except for this one figure to keep in mind – between 2000 and 2010, inflation accounts for a 26% increase in costs. What cost $100 in 2000, now costs $126.

My federal debt figures include debt held by the public and debt held by federal government accounts. Sometimes the media just uses the public debt figure.

My findings are presented in no particular order. They are observations, some of which bear closer scrutiny and analysis, but perhaps they point to a solution when taken as a whole.

The Findings – Revenue
First off, the “one-percent.”

In 2010, 135 million individual income tax returns were filed with the IRS reporting adjusted gross income (AGI) of $8.0 trillion on which $949 billion in income tax was paid to the government. Most (47.4% in 2011) of the revenue the government takes in comes from individual income taxes. Only 7.9% of total income came from corporate taxes in 2011. In 1962, corporations contributed 20.6% of the total and individuals accounted for 45.7%. This tells you all you need to know about what has happened with corporate income taxes over the years. The lowest contribution from corporate taxes over the past fifty years was under Obama in 2009 – just 6.6%.

There were 1.4 million tax returns comprising the top 1% of individual taxpayers in 2010. These lucky few paid $355 billion in income tax, which was 37% of the total individual income taxes paid that year. The average tax rate for those in the top 1% was 23%. The highest of any income category. If your 2010 AGI was greater than $370,000 you were in the 1% club. An AGI of $162,000 put you in the top 5%. Since the 2011 budget deficit was $1.3 trillion, you could double the taxes paid by the top 1%, and it would only cover 27% of what was needed that year to balance the budget. The implication of this is that spending cuts must be the primary contributor to balancing the budget.

By contrast, Mitt Romney’s 47% (or 50% to be precise) numbered 67.5 million tax returns in 2010 and paid $22 million in income tax which was just 2.4% of the total individual income tax collected by the government. The average tax rate for this group was 2.3%. You were in this group if your AGI was less than $34,000.

The Findings – Expenses
On the expense side, the Federal budget is divided into approximately twenty categories known as budget functions. The top five budget functions, representing 80% of all expenditures in 2011, were: Social Security (20.3%), Defense (19.6%) Income Security (16.6%), Medicare (13.5%) and Health (10.3%).

The nature of expenditures under Social Security, Defense and Medicare are clear. The Income Security budget function includes a range of programs that provide cash or near-cash assistance (e.g., housing, nutrition, and energy assistance) to low-income persons, and benefits to certain retirees, persons with disabilities, and the unemployed. Housing assistance programs account for the largest share of discretionary funding in this function. Major federal entitlement programs in this function include unemployment insurance, trade adjustment assistance income support, food stamps, Temporary Assistance to Needy Families, foster care, and Supplemental Security Income. Federal and other retirement and disability programs comprise approximately one third of the funds in this function.

The Health budget function includes direct health care services programs. Other health programs in this function fund anti-bioterrorism activities, national biomedical research, protecting the health of the general population and workers in their places of employment, providing health services for under-served populations, and promoting training for the health care workforce. Some of the agencies funded in this function include the National Institutes of Health, Centers for Disease Control and Prevention, Health Resources and Services Administration, and the Food and Drug Administration. The major mandatory programs in this function are Medicaid, the State Children’s Health Insurance Program, federal and retirees’ health benefits, and health care for Medicare-eligible military retirees.

So, since 80% of all spending can be grouped into five categories, how has each category fared from 2000  to 2010? The category experiencing the largest percentage increase in expenditures was Income Security. This category increased by 145%. As noted above, inflation over roughly the same period would have caused costs to rise by just 26%. Within the Income Security category, unemployment compensation was up a staggering 596% and food and nutrition assistance rose by 193%. Presumably, these increases have something to do with the Great Recession. This implies that a return to Clinton era levels of expenditure, once the economy improves, is not unreasonable.

The second highest increase in expenditures was seen in national defense which rose by 136%. Although it may surprise you to know that as a percentage of total government expenditures, the highest  level of spending on national defense was during the Kennedy administration when defense accounted for 49% of the budget in 1962 – think Cold War. Now, defense represents 19.6% (2011) of the federal budget. The lowest level of defense spending in the last fifty years was during the Clinton administration (16.1% in 1999). Clearly, this figure can come down as the wars in Iraq and Afghanistan wind down. The Clinton era level is again not unreasonable.

Medicare came just behind defense with an increase of 129% over ten years. Most of the spending in this category consists of payments for Medicare benefits. Since 1960, the median age of the U.S. population has risen from 29.5 to 37.2 years. As a percentage of the total population, those aged 65 and over have increased from 9% to 13%. By 2050, the projection is that this age bracket will represent 20% of the population. Is there a correlation between the increase in Medicare payments and the aging population?

Since 2000, the number of people aged 65 and older rose by 15%. I previously noted that inflation can account for an increase of 26% in expenses. These two factors get us nowhere near 129%. There appears to be a problem with cost control, and this is the main problem with health care reform. The entire industry must be redesigned – but not by Congress. We have Medicare, Medicaid and now Obamacare, with fifty separate state insurance exchanges soon to be in operation. Think of the cost savings and efficiency that could be achieved by putting everyone under one system. But this is a subject for another blog…

Social Security increased by 73% over ten years which seems mild compared to the other increases. But there is this question about solvency. Historically, payments coming into the Social Security trust funds have exceeded the benefits paid out. Which is a good thing. But the problem is, the government has been borrowing from these surpluses to help fund budget deficits. As of 2011, nearly $2.7 trillion has been borrowed from the trust fund to use for other purposes. Payroll taxes fund Social Security. But payroll taxes are only levied on the first $113,700 (in 2013) of annual wages. One solution to improving the solvency of Social Security is to increase the wage base upon which the tax is levied.

The final category comprising 80% of all expenditures is Health. This budget category rose by 139%, but I place it fifth, because it only represents 10.3% of total expenditures. The comments regarding cost control under Medicare are applicable here.

The Debt
National debt figures are usually presented as a percentage of GDP. This makes sense, and is what banks do, or at least are supposed to do, when they give you a mortgage. Banks determine what percentage your mortgage payment represents to your total income in order to get an indicator of your ability to pay your debts. It is the same with governments. The credit worthiness of a nation can be determined by its debt to GDP percentage, its prospects for growth, the efficiency and fairness of its tax system and the interest rate it has to pay on new debt.

Greece, for example, is a terrible credit risk. Its economy is in depression. There are no prospects for growth, its citizens have made an art form out of tax evasion and it has high borrowing costs. Yet, the European Central Bank continues to lend it money. Spain is headed in the direction of Greece as is Italy – although Mario Monti has done an admirable job of addressing some of Italy’s issues. But if Silvio Berlusconi gets back into power, they’ll be talking about rearranging deck chairs.

The United States has had the kind of luck with its national debt that even the Irish would envy. Interest rates on U.S. Government debt have been essentially zero after factoring in inflation. In fact, some issues from the Treasury have had negative real rates of interest. In other words, you have to pay the government interest for the privilege of lending it money, rather than the other way around. The U.S. is a good credit risk despite the fact that it has hit 100% of debt to GDP. We have been there before and have prospered since.

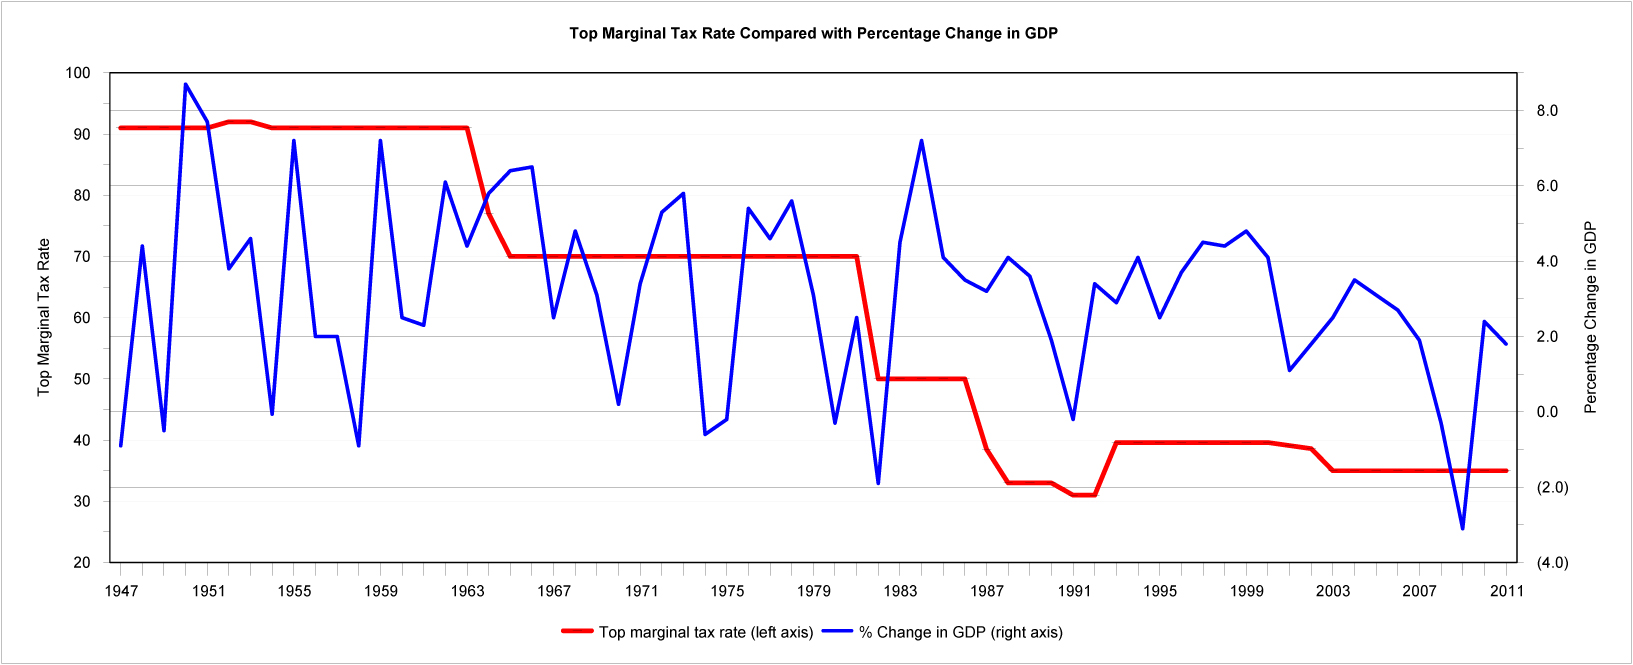
In 1946, just after World War II, U.S. debt was 121.7% of GDP. But, realizing that a war should be paid for and that debt should be paid down, the top marginal tax rate was set at 94%. Compare this rate with the current top rate of 35%, even though we are approaching a similar debt level to that of World War II. Historical experience suggests a top marginal rate of at least 50% if the debt is to be reduced. Wars cost money, and a combination of borrowing and high taxes helped foot the bill for World War II. Top tax rates were kept high after the War and only began to drop in 1964 under Johnson once the debt had declined to 39% of GDP. The top marginal tax rate was reduced further in 1982 to 50% under Reagan, and again five years later to 38.5%.

Conclusion
Like the cliff in King Lear, the fiscal cliff is imaginary. Taxes can increase and spending can be cut without ruinous consequences. The goal is to get to $1.3 trillion in a combination of spending cuts and tax increases based upon our current deficit.

On the revenue side, the rich do need to pay more. Since the end of World War II, they have seen an almost constant decline in their top marginal rate (see the next blog – Plucking the Goose). The goal should be to generate additional revenue of $350 billion from those with AGIs of $500,000 or higher. Obama’s $250,000 AGI figure sets the bar too low.

Similarly, corporations should pay their fair share of tax for the privilege of doing business in the U.S. Somehow, corporations have managed to convince national and local governments that they are blessed when a business locates in their domicile. It should be the other way around. Consider the benefits of doing business in the U.S. – a vast capital market, a somewhat impartial justice system, low levels of corruption, an educated workforce and so on. This should add another $100 billion to the tally.  That leaves $850 billion in spending cuts.

Taking defense back to Clinton era levels saves $330 billion after factoring in inflation. Assuming that increases in Income Security resulted from the Great Recession, a return to Clinton levels should cut perhaps $170 billion when the economy improves. Social Security should not be touched (since I would like to retire at some point), except that the wage base on which the tax is assessed can be adjusted upward as needed to address solvency. The government should also treat the Social Security trust fund as a true trust fund and not dip into it whenever they like to pay for other things. The big question is whether Medicare and Health services can be brought back to Clinton levels. If they can, this gives us the remaining $350 billion that is necessary to balance the budget.

It seems clear that all government health programs (Medicare, Medicaid, Obamacare) should be consolidated under one program. Cost control must also be a priority. The fiscal health of the country depends upon the health of its health care system.

Here’s to your good health in 2013! More later…

economist cover

Cliff Notes, Part I – Putting the Kettle On

14 Friday Dec 2012

Posted by Richard Watson in Economics and Taxation

≈ Leave a comment

Tags

Deficit, Federal Budget, Federal Debt, Federal Spending, Fiscal Cliff

This is a piece on taxation and expenditure in the United States. My goal is to provide you with an accountant’s view on the financial condition of our Government. We’ve heard from the politicians, economists and media outlets, but what can an accountant add to the fray? This will be a two-part blog, with the second part containing an analysis of the Federal budget.

This part is a circuitous and whimsical look at governments, taxes and accountancy.

Poets and Scholars
What kind of perspective can an accountant provide? Well…accountants, don’t you know, invented writing and are the original poets. Who better to turn drab columns of numbers into a coherent literary analysis? P.G. Wodehouse put it best when he observed that poets must have a firm grasp of accounting principles:

Poets, as a class, are business men. Shakespeare describes the poet’s eye as rolling in a fine frenzy from heaven to earth, from earth to heaven, and giving to airy nothing a local habitation and a name, but in practice you will find that one corner of that eye is generally glued on the royalty returns.

But surely I jest and gibe when I claim accountants invented writing?

The oldest discovered pieces of writing are found on clay tablets dating back to 3300 BCE. The hieroglyphic writings on these tablets were found in the tomb of the Egyptian King Scorpion and primarily represent tax records. In Georges Ifrah’s The Universal History of Numbers, it is noted that “[w]riting was invented by accountants faced with the task of noting economic transactions which, in the rapidly developing Sumerian society, had become too numerous and too complex to be merely entrusted to memory.” Surprisingly, over ninety percent of the known cuneiform documents from ancient Mesopotamia are about economic and tax matters. Symbols on these documents representing grain, animals and labor indicate settlement of business transactions or payment of taxes.

The World’s Second Oldest Profession
For millennia, taxes were assessed on the produce of the land and paid in kind. The income tax is a modern invention. Those without means paid taxes in the form of compulsory labor service. In A History of Taxation and Expenditure in the Western World, Carolyn Webber and Aaron Wildavsky observe that “[c]orvée, the mandatory contribution of personal labor to the state, was the earliest form of taxation for which economic records exist; indeed, in the ancient Egyptian language the word “labor” was a synonym for taxes.”

From Mesopotamia to Rome, kings, temple priests and governments outsourced the collection of taxes to prominent businessmen or elders who usually had some form of wealth. These “tax farmers” were responsible for paying the tax to the government whether or not they collected it from the citizens. You can imagine someone going from Palermo to Naples, collecting little brown envelopes….

However, throughout most of history, taxpayers received very little in exchange for their tax dollar, franc or pound sterling. Governments were not in the business of looking after the welfare of its citizens. It was Adam Smith, who in the Wealth of Nations (1776) wrote…

Wherever there is great property, there is great inequality…Civil government, so far as it is instituted for the security of property, is in reality instituted for the defence of the rich against the poor, or of those who have some property against those who have none at all.

Yet, some form of government is necessary, and debate about the proper role and function of government is nearly as old as, well, the invention of writing. Thomas Hobbes wrote that legitimate political power must be representative and based on the consent of the people. He imagined a world without government and in 1651 observed that:

In such condition, there is no place for industry; because the fruit thereof is uncertain: and consequently no culture of the earth; no navigation, nor use of the commodities that may be imported by sea; no commodious building; no instruments of moving, and removing, such things as require much force; no knowledge of the face of the earth; no account of time; no arts; no letters; no society; and which is worst of all, continual fear, and danger of violent death; and the life of man, solitary, poor, nasty, brutish, and short.

So, to keep us at our best, some form of government is necessary. The nature of society, and consequently its expectations from government, began to change during the Industrial Revolution (1750-1850). Prior to this time, mass poverty had been the norm. But as people broke their long connection with the land and moved to cities, a host of new demands were made on governments. From Webber and Wildavsky again:

Changes in patterns of life and work during the nineteenth century converted individual problems of personal welfare into social issues…In an environment of widening franchise, governments no longer served only to protect the rights of the wealthy: they began to take action to improve the lives of the poor…Pushed by continuing unrest associated with depression-induced unemployment, nineteenth-century legislatures slowly responded to reformers’ demands…

It took a bothersome colony some distance away from Hobbes’ native England to pick up on his “representation” theme. You could argue that the United States declared its independence as a result of a tax dispute. England needed funds to pay for troops stationed in its various colonies around the world, and the English Stamp Act of 1765 was designed to provide that revenue. It also started all the fuss about taxes in the colonies. Ben Franklin  reflected that the colonies would need to be represented in Parliament if they were to be taxed…but, since we were essentially good English men and women, it took a disagreement about tea in 1774 to really put the kettle on.

The United States was able to finance and win its Revolutionary War thanks to heavy lending from France. The French figured they could keep England bogged down in an overseas war (just like the Americans felt they could do to the Soviet Union in Afghanistan – sorry, I couldn’t resist) and not only provided credit but also ships and troops.

How did we repay France? We defaulted. According to Simon Johnson and James Kwak in White House Burning:

Less than six years after the Treaty of Paris ended the American Revolutionary War, the new nation was deeply in debt and already in default. The United States had missed interest payments owed to France for several years in succession, as well as principal payments due in 1787 and 1788.

So not only were the French no longer able to eat their cake, some of them got le guillotine and the rest got the French Revolution which began in 1789, to be followed by the Reign of Terror in 1793, and Napoleon in 1799.

With French funding no longer available, how did the U.S. pay for its government? Except for a short time during the Civil War, the United States derived its revenue almost entirely from tariffs on imports. One of the first federal income tax laws was signed by President Lincoln in 1862 to help finance the Civil War, but it was repealed several years later.

Income taxes did not become widely utilized until the early 1890s when several nations adopted various forms of income tax. Up until World War I, financial policies of most Western nations incorporated elements of taxation and expenditure that were holdovers from the nineteenth century: minimal government supported by a few low but productive indirect taxes; and small spending for welfare, defrayed from insurance funds and the proceeds of progressive income and inheritance taxes paid by the rich.

In the United States, the Wilson-Gorman Tariff Act of 1894 imposed the first peace time income tax which was equal to 2% of incomes greater than $4,000. This represented less than 10% of households at the time. The following year, the Supreme Court held the tax to be unconstitutional, because it violated the Constitution’s prohibition against unapportioned direct taxes.

But, since you can always change what you find disagreeable in the Constitution, and with war looming again, the ratification of the 16th Amendment to the U.S. Constitution in 1913 famously did away with the apportionment requirement:

The Congress shall have power to lay and collect taxes on incomes, from whatever source derived, without apportionment among the several States, and without regard to any census or enumeration.

This means that next year will be the 100th birthday of the modern income tax in the United States. Since that time, two World Wars, and a surge in global population from 1.6 billion in 1913 to a projected 7.0 billion in 2013, have created vast cradle-to-grave welfare societies with a dependency on governments never known before.

So how are we to avoid a Malthusian budgetary catastrophe? Read on in Part II – Tea Time.

…………………………….

Reverend Thomas Malthus felt that populations would continue to grow until they exhausted available resources at which point havoc and mayhem would sweep the land until population size reduced back to a sustainable level. I am of course, paraphrasing.

………………………………

Some accountancy from Monty Python –

…our experts describe you as an appallingly dull fellow, unimaginative, timid, lacking in initiative, spineless, easily dominated, no sense of humour, tedious company and irrepressibly drab and awful. And whereas in most professions these would be considerable drawbacks, in charted accountancy they are a positive boon.

unclsam1

O’Romney’s Cake

16 Tuesday Oct 2012

Posted by Richard Watson in Economics and Taxation

≈ 1 Comment

Tags

JCT, Joint Committee on Taxation

The Joint Committee on Taxation (JCT) is a committee established by Congress with several duties. Among them are to make reports, studies and recommendations concerning taxes. They’ve recently run some numbers as part of an “experiment” to see how much the income tax rates could be reduced if they “broadened” the tax base. I thought I would pass the results along so you can be armed with some knowledge for tonight’s debate. That way, you can throw things at the TV screen when both Obama and Romney flub the figures.

It must be understood what is meant by “broadening” the tax base. This means increasing the amount of income that is taxed. This is usually done by getting rid of deductions and exclusions which causes the amount of tax you pay to increase, even though the rates remain the same. The JCT’s experiment eliminated ALL itemized deductions, repealed the Alternative Minimum Tax patch, taxed capital gains and dividends at ordinary income rates and assumed that individual tax rates will rise in 2013 (that is, if you are currently in the 25% tax bracket, you will be in the 28% tax bracket in 2013).

Republicans make the argument, which is true to a point, that you can broaden the tax base by lowering tax rates. This theory assumes that as more people are put to work and unemployment falls, more income is available to tax. Think of having a cake from which the government would like to eat. If the size of the cake remains the same, and the government takes a larger slice, that means less cake for you. However, if the size of the cake doubles and the government takes a smaller slice as a percentage of the total, it may be possible to increase the amount of revenue flowing to the government (mathematically, think 25% of $100 = $25 and 20% of $200 = $40).

The other phrase to keep in mind is “revenue neutral.” Proposed changes to tax law are revenue neutral if they neither increase nor decrease the total revenue flowing to the government. So, regardless of the size of the cake, the government’s piece is fixed and does not change.

The result of JCT’s experiment was that in order to keep proposed tax changes revenue neutral, you could only lower tax rates by 4% using the assumptions made in their report. Semantically, this allows me to say that I plan to lower your taxes by 4% and keep my proposed changes revenue neutral by broadening the tax base. What I have actually done is increase your taxes. How? Remember that next year your marginal rate automatically rises from 25% to 28%. A 4% reduction in the 28% rate drops you to 26.88%. Plus, you have just lost all your itemized deductions which means that more of your revenue is taxed at the higher 26.88%. N’est pas?

The lesson? A politician who talks about lowing tax rates without providing specific examples of how tax laws would change is planning on raising your taxes.

Random Musings

02 Thursday Feb 2012

Posted by Richard Watson in Economics and Taxation

≈ Leave a comment

Tags

chancellor angela merkel, money market mutual funds

From the January 31, 2012 issue of the Financial Times comes the following in no particular order:

Poland’s foreign minister recently called for more German leadership concerning Europe’s sovereign debt crisis. The German Chancellor, Angela Merkel, has agreed to campaign for Mr. Sarkozy in this year’s French presidential election…irony?

European banks are now asking for one trillion euro in emergency funding. Apparently, some of the banks have been using this money to invest in higher-yielding euro-zone sovereign bonds in an effort to drive down borrowing costs for the likes of Italy, Spain, Ireland and Greece…defaults in the making?

And…yields on Portugese 10-year bonds have hit 17 percent. This is reminiscent of those Icelandic banks that were offering high interest rates on certificates of deposits just before the big crash…coincidence?

Greece will struggle to meet its target for asset sales even by the already delayed deadline of 2017. Private equity firms are visiting Athens shopping for bargains…imminent collapse of the real estate market?

Data on US money market mutual funds suggest that dollar deposits withdrawn from European banks have gone to other international banks or directly into US bond markets…panic?

Big Government May Soon Cash Your Paycheck

17 Thursday Feb 2011

Posted by Richard Watson in Economics and Taxation, Political Commentary

≈ Leave a comment

Rather astonishingly, the FY 2012 budget includes a proposal that would require W-2s to be reported on a quarterly basis, rather than annually.  To go along with this, the Obama administration has requested $13.3 billion to fund the IRS in FY 2012. This is a $1.1 billion increase from FY 2010.  Over the last few years, our government has passed laws which some see as an attempt to turn tax professionals from their traditional role of taxpayer advocate into IRS informant (for instance, disclosure requirements concerning uncertain tax positions). But don’t worry, CPAs still work for their clients rather than the government. Still, the IRS budget includes $17 million to increase oversight of tax return preparers. They are trying to keep the heat on the profession.

Since wage information is already collected quarterly (in the form of payroll tax returns), the only logical reason to require quarterly W-2s would be to…well, I can’t think of one. Perhaps the US is thinking that it would be best if your employer paid the IRS first, then deducted what it thought you should pay in tax, and finally remitted what ever paltry sum was left to you. After, of course, taking from your pay whatever you may owe on your credit card or mortgage. Because, afterall, we must keep the bankers happy with their bonuses while the rest of us continue to pay.


Being Economical with the Truth

02 Thursday Dec 2010

Posted by Richard Watson in Economics and Taxation

≈ Leave a comment

In Some Experiences of an Irish R.M., one of Mrs. Knox’s horses has gone missing and Major Yeates observes that her grandson, Flurry Knox. “…was not – to put it mildly – shrinking from that economy of truth that the situation required.” The President’s National Commission on Fiscal Responsibility and Reform is calling for a major tax overhaul in its delightfully titled report The Moment of Truth. The Commission is certainly not shrinking from its responsibilities.

The report proposes what is likely to be a massive tax cut for the very wealthy and a tax increase for the rest of us. Ideally, the Commission would like to see the highest individual tax rate set at 23%. It is currently 35%. The 35% rate applies to taxable incomes over $373,651. So, if your taxable income is $410,000, you would save $49,200 a year in income tax under the Commission’s proposals. Remember that prior to the Tax Reform Act of 1986 and the Reagan tax cuts, which were meant to simplify the tax code, the top individual tax rate was 50%.

When Irish Eyes are Smiling

In the eye of its economic storm, Ireland is stubbornly refusing to raise its corporate tax rate which sits unyieldingly at 12.5%, and has instead chosen to inflict economic pain on everyone else – with the exception of senior debt holders in Irish banks, who are being bailed out by taxpayers in the European Union. In solidarity with Ireland, our National Committee on Fiscal Responsibility and Reform (what George Orwell would have called the “Truth Commission”) would like to see the corporate income tax rate as low as 23%. The maximum corporate rate is currently 39%.

Meanwhile, the Commission is proposing that all itemized deductions for individuals be eliminated… More later once I have a chance to read through the report in detail.

Quote of the Month

30 Tuesday Nov 2010

Posted by Richard Watson in Economics and Taxation

≈ Leave a comment

In discussing British austerity measures which will cut government spending on civil services by one-third, Tony Blair’s former chief of staff, Jonathan Powell, is quoted in The Financial Times as saying that the coalition government is “…following the precepts of Machiavelli: you need to be really bold and inflict the pain very quickly.”

← Older posts

Recent Posts

  • “Been a Breach of Promise” October 5, 2019
  • Returning to Earth December 13, 2018
  • What is to be Done?* August 3, 2018
  • Chronology of an Appendectomy May 16, 2018
  • Stormy Weather February 24, 2018

Pages

  • About Richard Watson
  • Photographs

Blogroll

  • Leanne Waldal
  • Moya Watson
  • Watson House

Archives

Enter your email address to follow this blog and receive notifications of new posts by email.

Join 117 other followers

Blog at WordPress.com.

Cancel